Solution Description
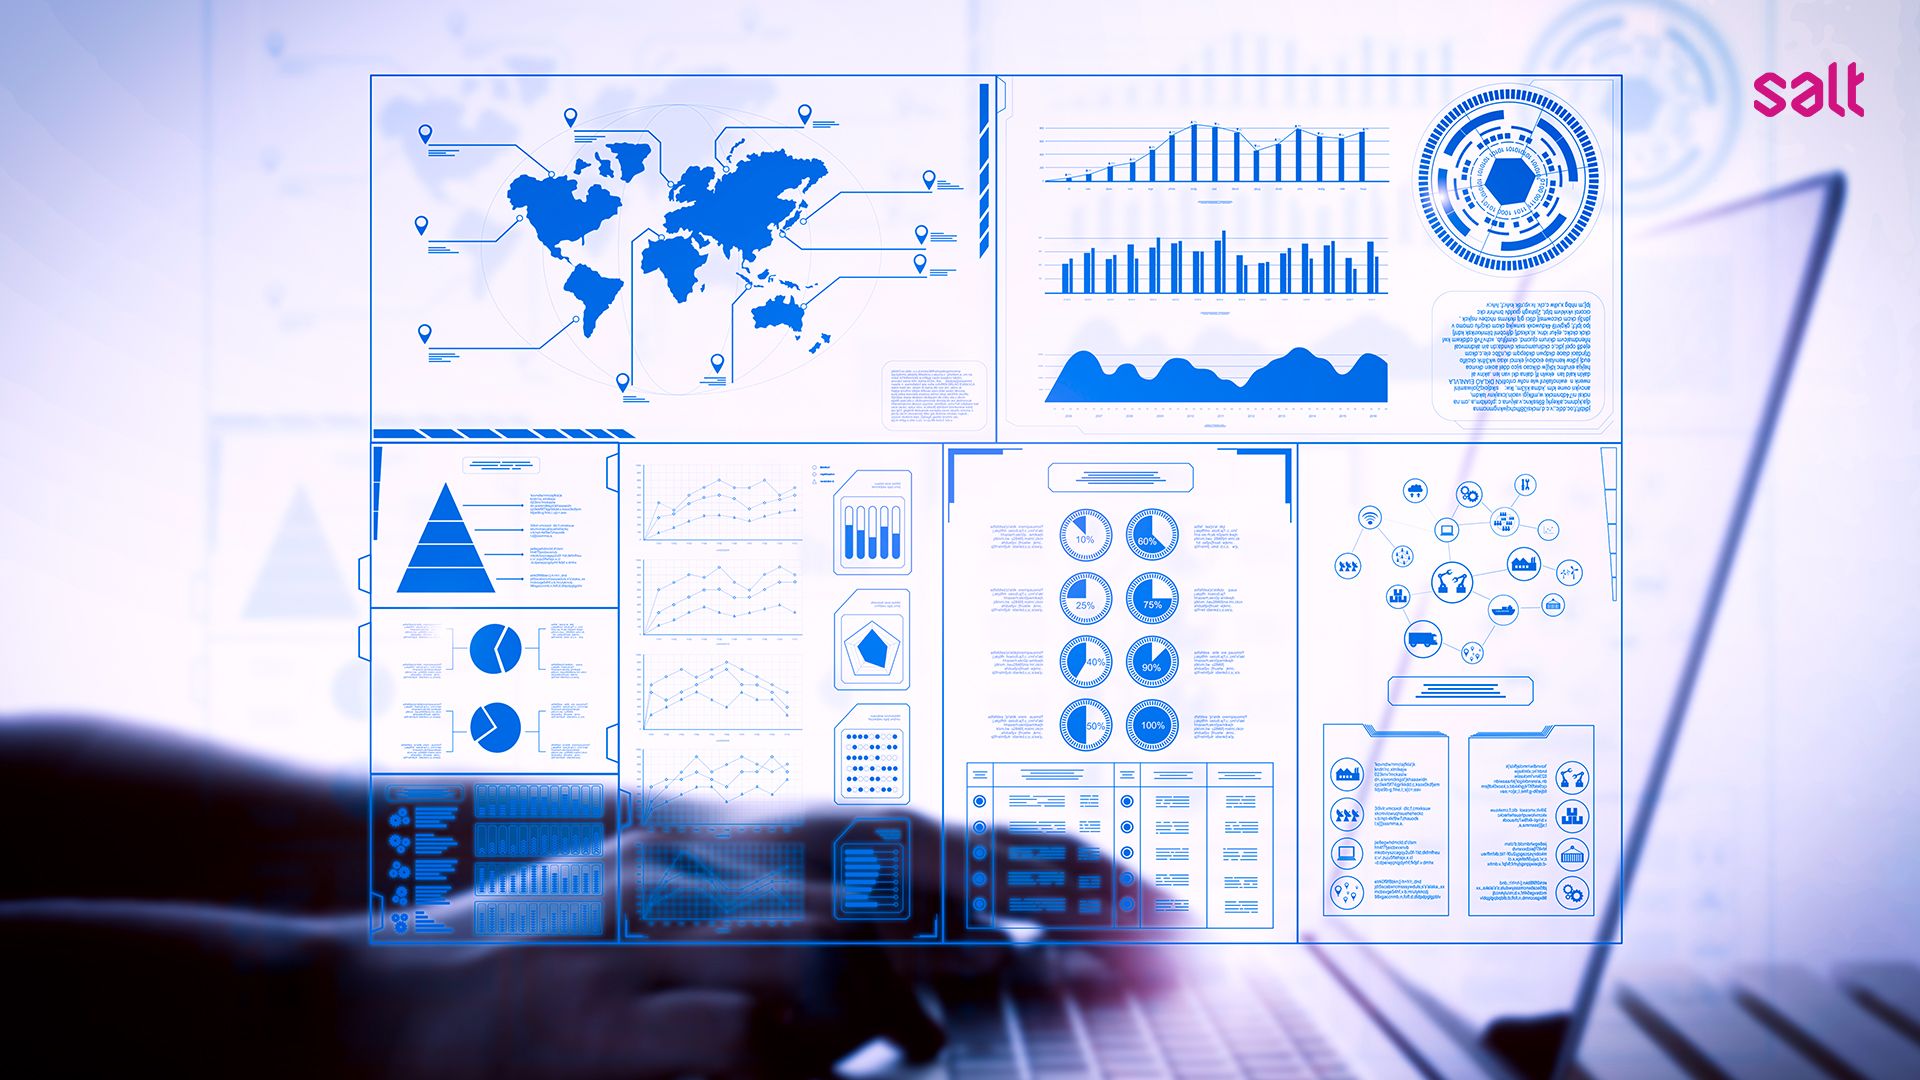
Data visualization and dashboards make it easier for teams, especially leaders, to understand complex information. They turn numbers and data into simple visuals like charts & graphs, helping people view patterns and problems more clearly. This makes it quick to spot what's working and what isn't.
These tools also help teams make brilliant decisions. By showing trends & areas that need attention, they guide your teams to improve how things work. For example, they can help better predict finances, fix supply chain issues, or improve customer's experiences of a product or service.
Overall, using these tools helps your business grow and stay ahead of competitors. The valuable insights enable companies to work more efficiently and make better choices, keeping them prepared for future challenges.
Benefit and Value Proposition
- Customizable Solutions
Tailor the platform to match your specific business workflows and requirements effortlessly. - Secure and Scalable Infrastructure
Keep your data safe with advanced security measures and grow confidently with a system that scales as you do. - Self-Service Analytics
Access intuitive dashboards that empower your team to analyze data without requiring technical know-how. - Expert Support and Training
Rely on a dedicated support team and comprehensive training to help you achieve your business goals. - Seamless Integrations
Easily connect the platform with your existing tools and data systems for streamlined operations.
Industries Well-suited for the Data Visual Dashboarding
Advanced Dashboarding Systems offer impactful solutions for various fields. The following industries are especially well-positioned to benefit from their capabilities:
- Finance
The finance industry relies heavily on data analysis and reporting to make informed decisions. Advanced dashboarding systems provide a comprehensive view of financial performance, trends, and forecasts, enabling stakeholders to monitor key real-time metrics like revenue, expenses, and market conditions. This level of insight empowers finance industries to optimize strategies and maximize profitability. - Banking
Banking professionals handle vast amounts of data daily, from transaction records to customer insights. With advanced dashboarding systems, banks can track key performance indicators (KPIs), assess credit risks, improve customer experiences, and ensure compliance with regulatory standards. These tools drive efficiency and support data-driven decision-making at every level of operations. - Fast-Moving Consumer Goods (FMCGs)
FMCG companies operate in a fast-paced environment where quick analysis of market trends is critical. Data visualization dashboards allow businesses to manage supply chains, measure sales performance, and gain insights into consumer behavior in real-time. This helps streamline operations and adapt to market demands efficiently, ultimately boosting agility and competitiveness. - Telecommunications
The telecommunications industry requires robust tools to manage complex datasets related to network performance, customer engagement, and subscriber churn rates. Dashboarding systems enable telecom providers to monitor and optimize their networks, deliver superior customer service, and plan future infrastructure development, ensuring uninterrupted connectivity and enhanced user satisfaction. - Government
The government handles extensive data related to public services, infrastructure, and policy outcomes. Advanced visual dashboards effectively present this information, making it more accessible to decision-makers and citizens alike. By leveraging such systems, governments can improve transparency, track program effectiveness, and make evidence-based decisions to address community needs efficiently.
Customer Wins
Unilever, Danone, Batumbu, Jamkrindo, Cascade, Polri, AIA, Telkomsel, and many more.
How Visual Data Can Help Businesses Challenges
- Improving Decision-Making
Data visualization dashboards simplify complex information by showing key metrics and trends in an easy-to-understand visual format. This helps decision-makers quickly spot patterns, solve problems, and seize opportunities with reliable insights. - Enhancing Operational Efficiency
Dashboards bring key metrics and KPIs into one place, making it easier to track performance. They help businesses quickly find issues, improve resource use, and make better decisions. With a clear view of operations, organizations can optimize workflows and align activities with their goals. - Mitigating Risk
A good data dashboard helps businesses spot risks early by showing unusual or unexpected data. This enables organizations to assess issues and take action quickly. For instance, finance teams can catch irregular transactions, and supply chain managers can prepare for possible disruptions to minimize impacts. - Adapt to Changes
Data visualization dashboards help businesses stay agile by providing real-time updates. With instant insights, companies can quickly respond to market trends, customer behavior, or operational issues. This flexibility ensures businesses stay competitive and make smart, timely decisions.
Expected Result
- Increase 50% Effectiveness in business decision-making
- 30% Reduction in Time Spent on reporting
- Reduce Up to 20% Risk of Error by humans and/or systems
- Streamlining Business Operations across multiple areas
What We Offer
- Dashboard UI/UX Design:
We create simple, user-friendly dashboards that make data easy to access and understand. Our focus is on clear design and functionality to help businesses interpret key information quickly. - Visual Dashboard through Web/App Development:
We create responsive dashboards for web & mobile, tailored to your business needs. These dashboards provide real-time data visualization and work seamlessly across all devices. - Report Customization:
Get reports tailored to your business needs. We deliver the insights you need in the format you prefer. - Data Integrations:
Our tools easily connect to your data sources, combining information into one reliable system. This ensures efficiency and consistency across your business. - Technical Support for Maintenance:
We provide reliable support to keep your systems running smoothly. Our team handles troubleshooting and updates to minimize downtime and maximize efficiency.
Deal Size
The cost starts from IDR 100 million, but it may vary depending on your business needs, as our pricing is customized to meet your specific requirements. Contact us for a tailored quote.
Starting Points
- Prepare your business background and goals that you want to achieve through Data Visual Dashboard solutions.
- Schedule a consultation with us to discuss how we can help you achieve your business goals with our experts.
- Determine your budget to align with your specific requirements and desired outcomes.

